Trendline plotting is a common practice within statistical analysis used to identify a pattern or ‘trend’ being displayed by the data. The trendline works by plotting a ‘line-of-best-fit’ across all data points in the reporting period, the result being a single line representing the trend found within the data with the slope of the line representing the direction and strength of the trend.
A plotted trendline is created from data which can also be displayed in a raw, numerical form in tabulated reports. This allows you to supply trend analysis and predictive data to all relevant reports within Statseeker.
Trend reporting in Statseeker can be used to give an indication of the direction and rate of change for a statistic over the reporting period and into the future. This is particularly useful for capacity planning with regard to disk usage or interface utilization. As with all trend analysis:
Trend data can be added to any report created in the Reports panel.
Statseeker offers a range of trend data for inclusion in custom tabular reports, for more information on creating reports, see Custom Reports.
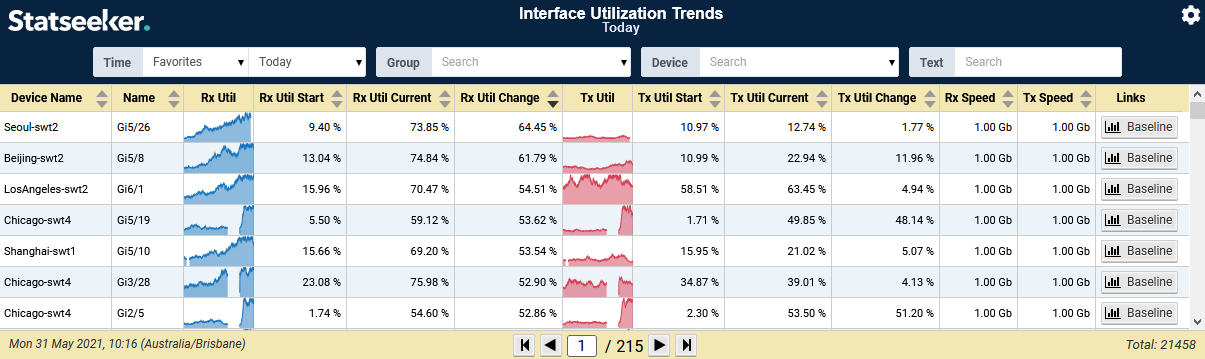
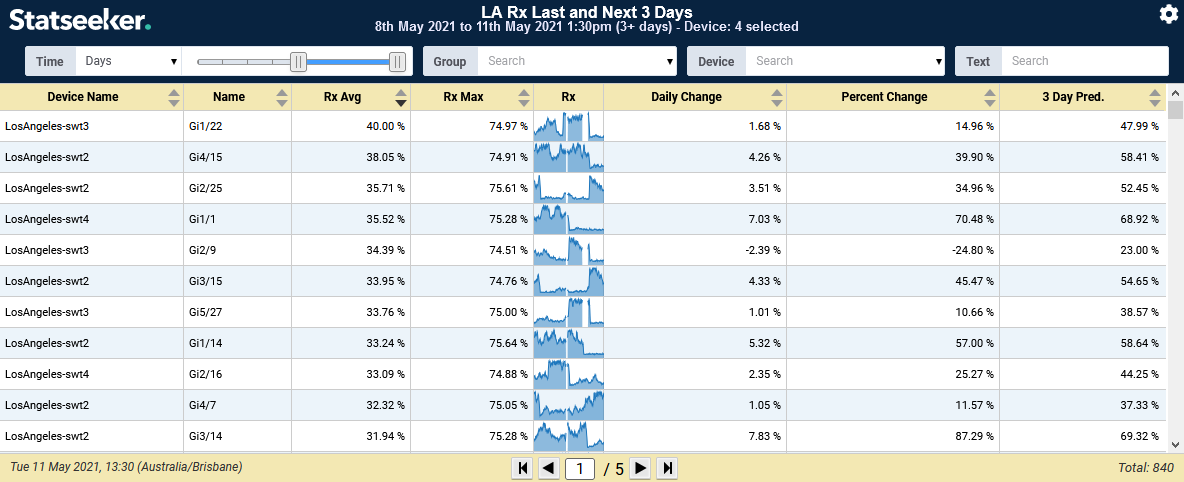
An example of employing trendline data in tabular reports can be seen in the Interfaces > Utilization Trends report in the Console.
The trend data available when configuring custom tabular reports is:
To add trend data to a report:
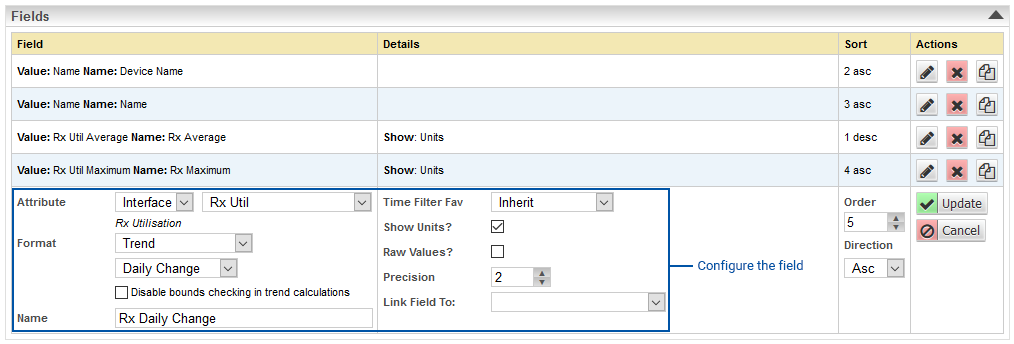
In the example used here we have selected an interface received traffic report so that is the metric we will be retrieving trend data on.
This will display an additional field under Trend offering a drop-down list of trend analytic options.
In the example below, we have added fields for Trend Percent Strength and a 3 day Trend Prediction.
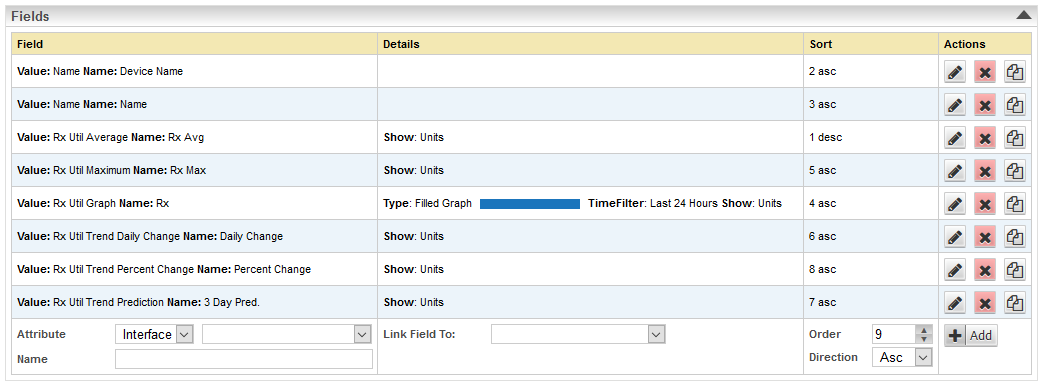
Note: when configuring the Trend – Prediction analytic you are offered additional fields for defining the scope of the prediction.
[top]
To add trend data to a report:
In the example used here we have selected an interface traffic report.
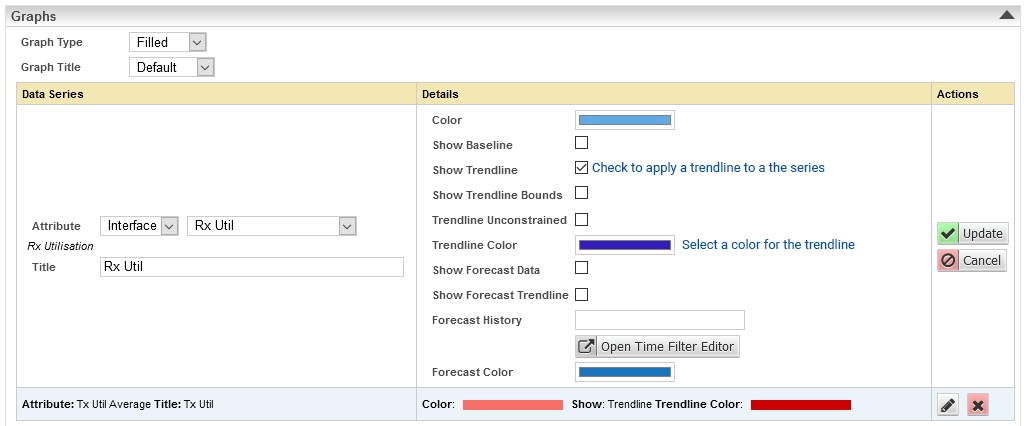
Trendline Unconstrained: when unchecked, the trendline is forced to remain within the upper and lower bounds of the displayed report data. When checked, the trendline is applied as a true line-of-best-fit, see Considerations when Using Trendline Analysis for more information around this feature.
There is also an option to display Trendline Bounds on any graph displaying a trendline. The trendline bounds refer to the range of expected values around the trendline for a given point on the graph. To display trendline bounds:
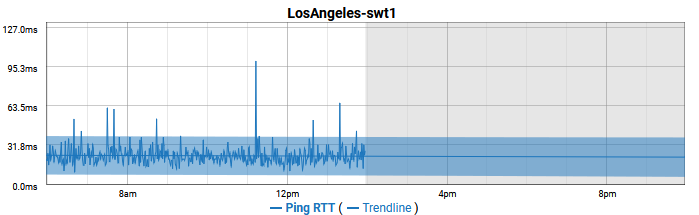
Trendlines on graphs can be projected out into the future to provide an indication of the impact of the trend over time. This can be used for capacity planning by offering some indication of when thresholds may be reached if the trend holds true. To project a trendline into the future simply adjust the time filter so that the reporting period extends into the future.
E.g. now – 30d to now +30d or start-of-this-month to end-of-next-month . For more information on setting time filters and populating time filter lists by adding new time filter favorites, see Time Filters.
[top]
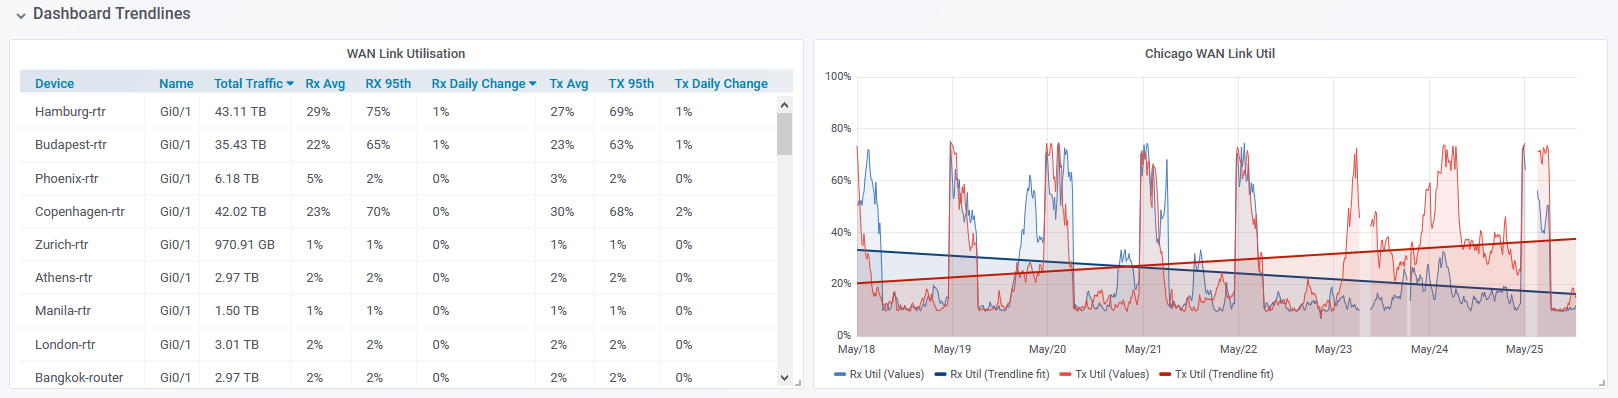
Trendlines can be applied to timeseries data used in dashboards. The Fields, Filters and Sort By sections of your dashboard configurations all allow trendline formats. Applying trendline formats only differs from applying other formats in that some require additional options set, see Dashboard Timeseries Data Formats for details.
Note: for details on all aspects of dashboards use, configuration and management, see Statseeker Dashboards.
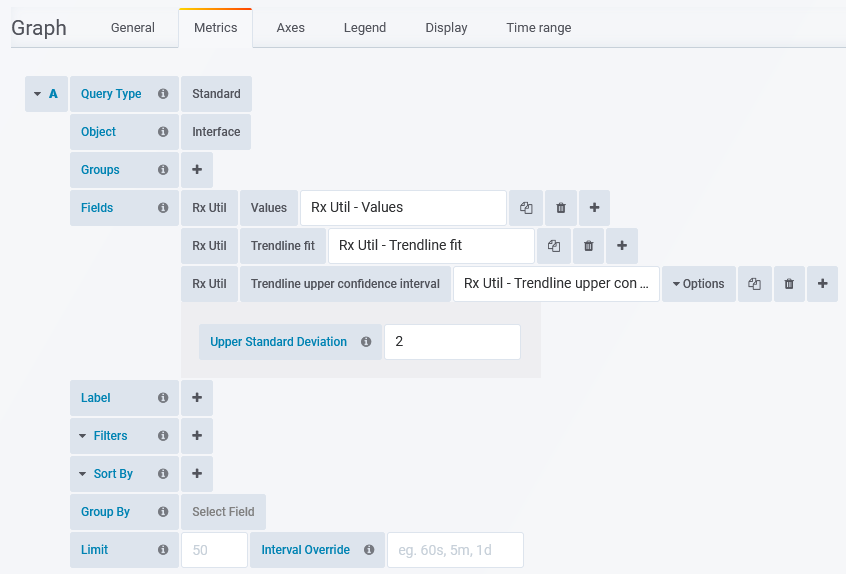
To add trendline data to your dashboards as either Field, Filter or Sort By content:
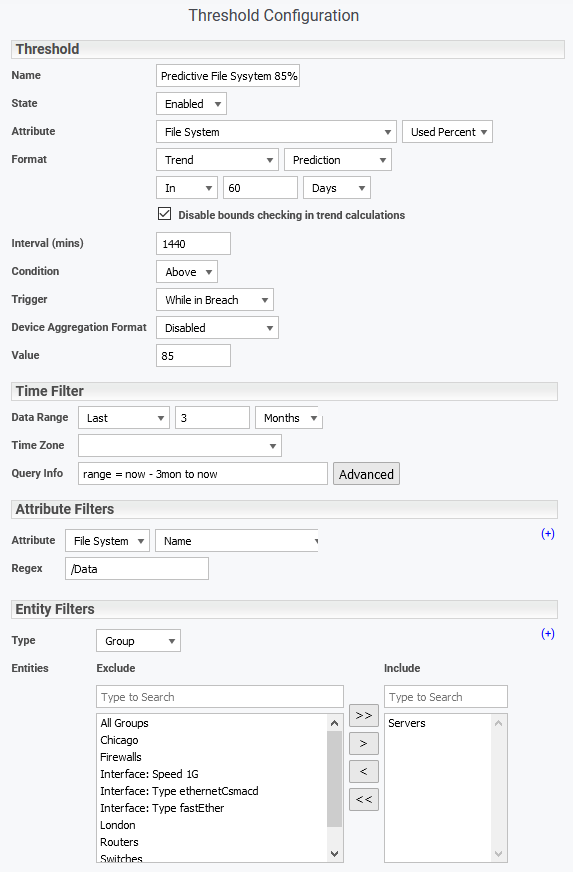
Trendline data can also be utilized in Threshold configuration.
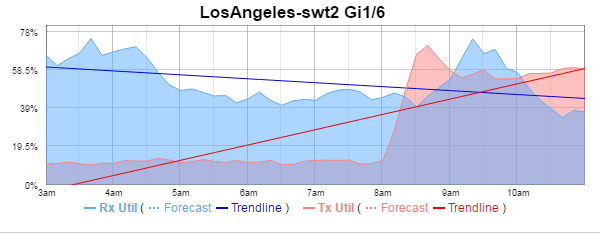
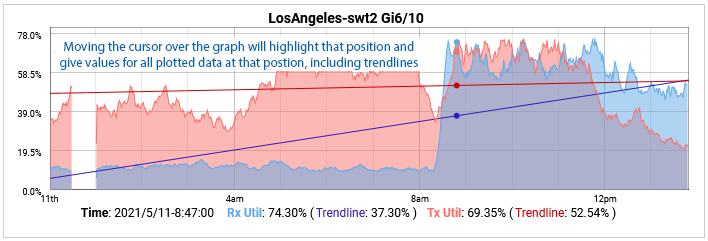
In the example below, we are looking at the traffic across an interface from 3 days previous to 7 days into the future. This time period captures the end of a weekend and the start of a week.
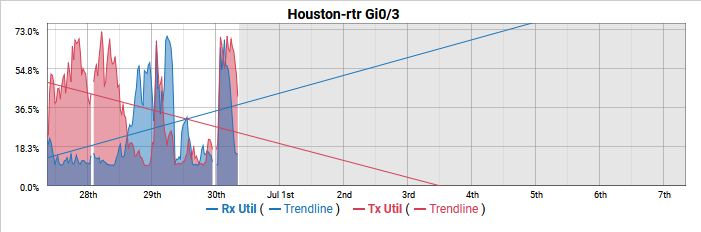
The trendline indicates that the inbound traffic is increasing very rapidly, and in comparison to the weekend we have seen a large increase in the received data. Conversely, we have seen a marked decrease in the outbound data.
Pushing the reported time frame out to 30 days in the past we see the received traffic trendline has flattened out indicating a very minimal change and a slight increase in the outbound traffic over the reporting period.
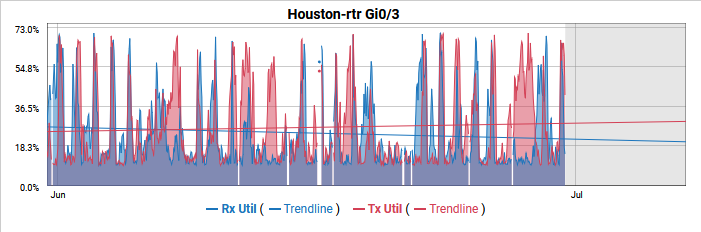
Both trendlines are correct, mathematically they are the single line that best describes the data series they represent. When working with highly variable data, like we are here, the trendline Strength is low. The trendline cannot be used as an accurate predictor of actual values, but can be safely relied upon to indicate if the data series is increasing/decreasing, with the slope of line giving an indication of the magnitude of the change over the reporting period.
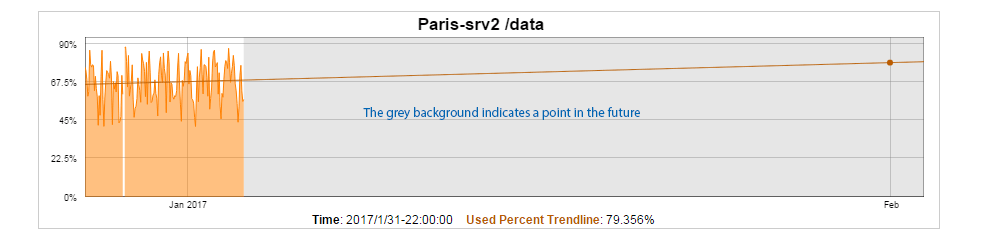
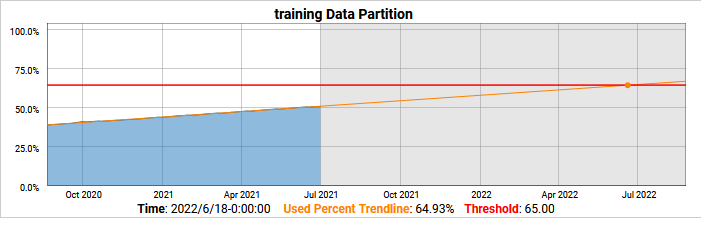
The following graph presents a server data partition over time. The data is not very variable and the trend strength is high (the trendline fits very closely to the data).
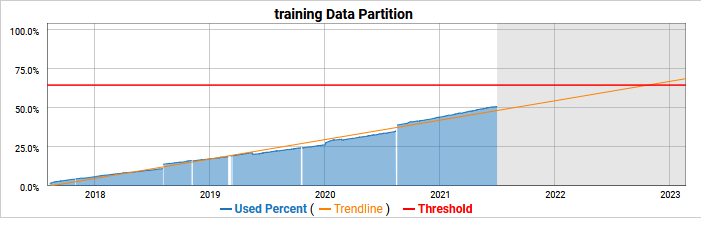
When the trend strength is high we can safely project our trendline into the future as a predictor, in this case, a predictor data partition utilization.
This particular data partition stores Statseeker data and was resized in late August 2020 when a large number of additional devices started to be monitored. We can modify the timefilter used on this report to present data from that event onwards and the trend strength gets extremely high.
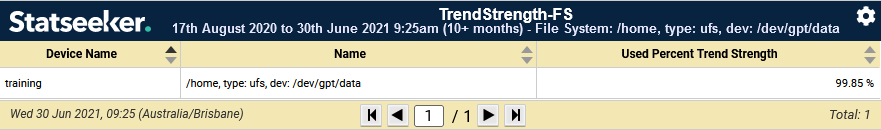
We can see now that the trendline fits even more closely to the data and can be used as a very accurate predictor into the future.
[top]